
What the land
will give back
before you plant.
Soil composition, satellite passes, and microclimate windows — combined into per-acre yield predictions before the first seed breaks ground.
Three data streams.
One ground truth.
Before the model runs a single inference, the ingestion pipeline validates, cross-references, and spatially aligns inputs down to the parcel boundary.
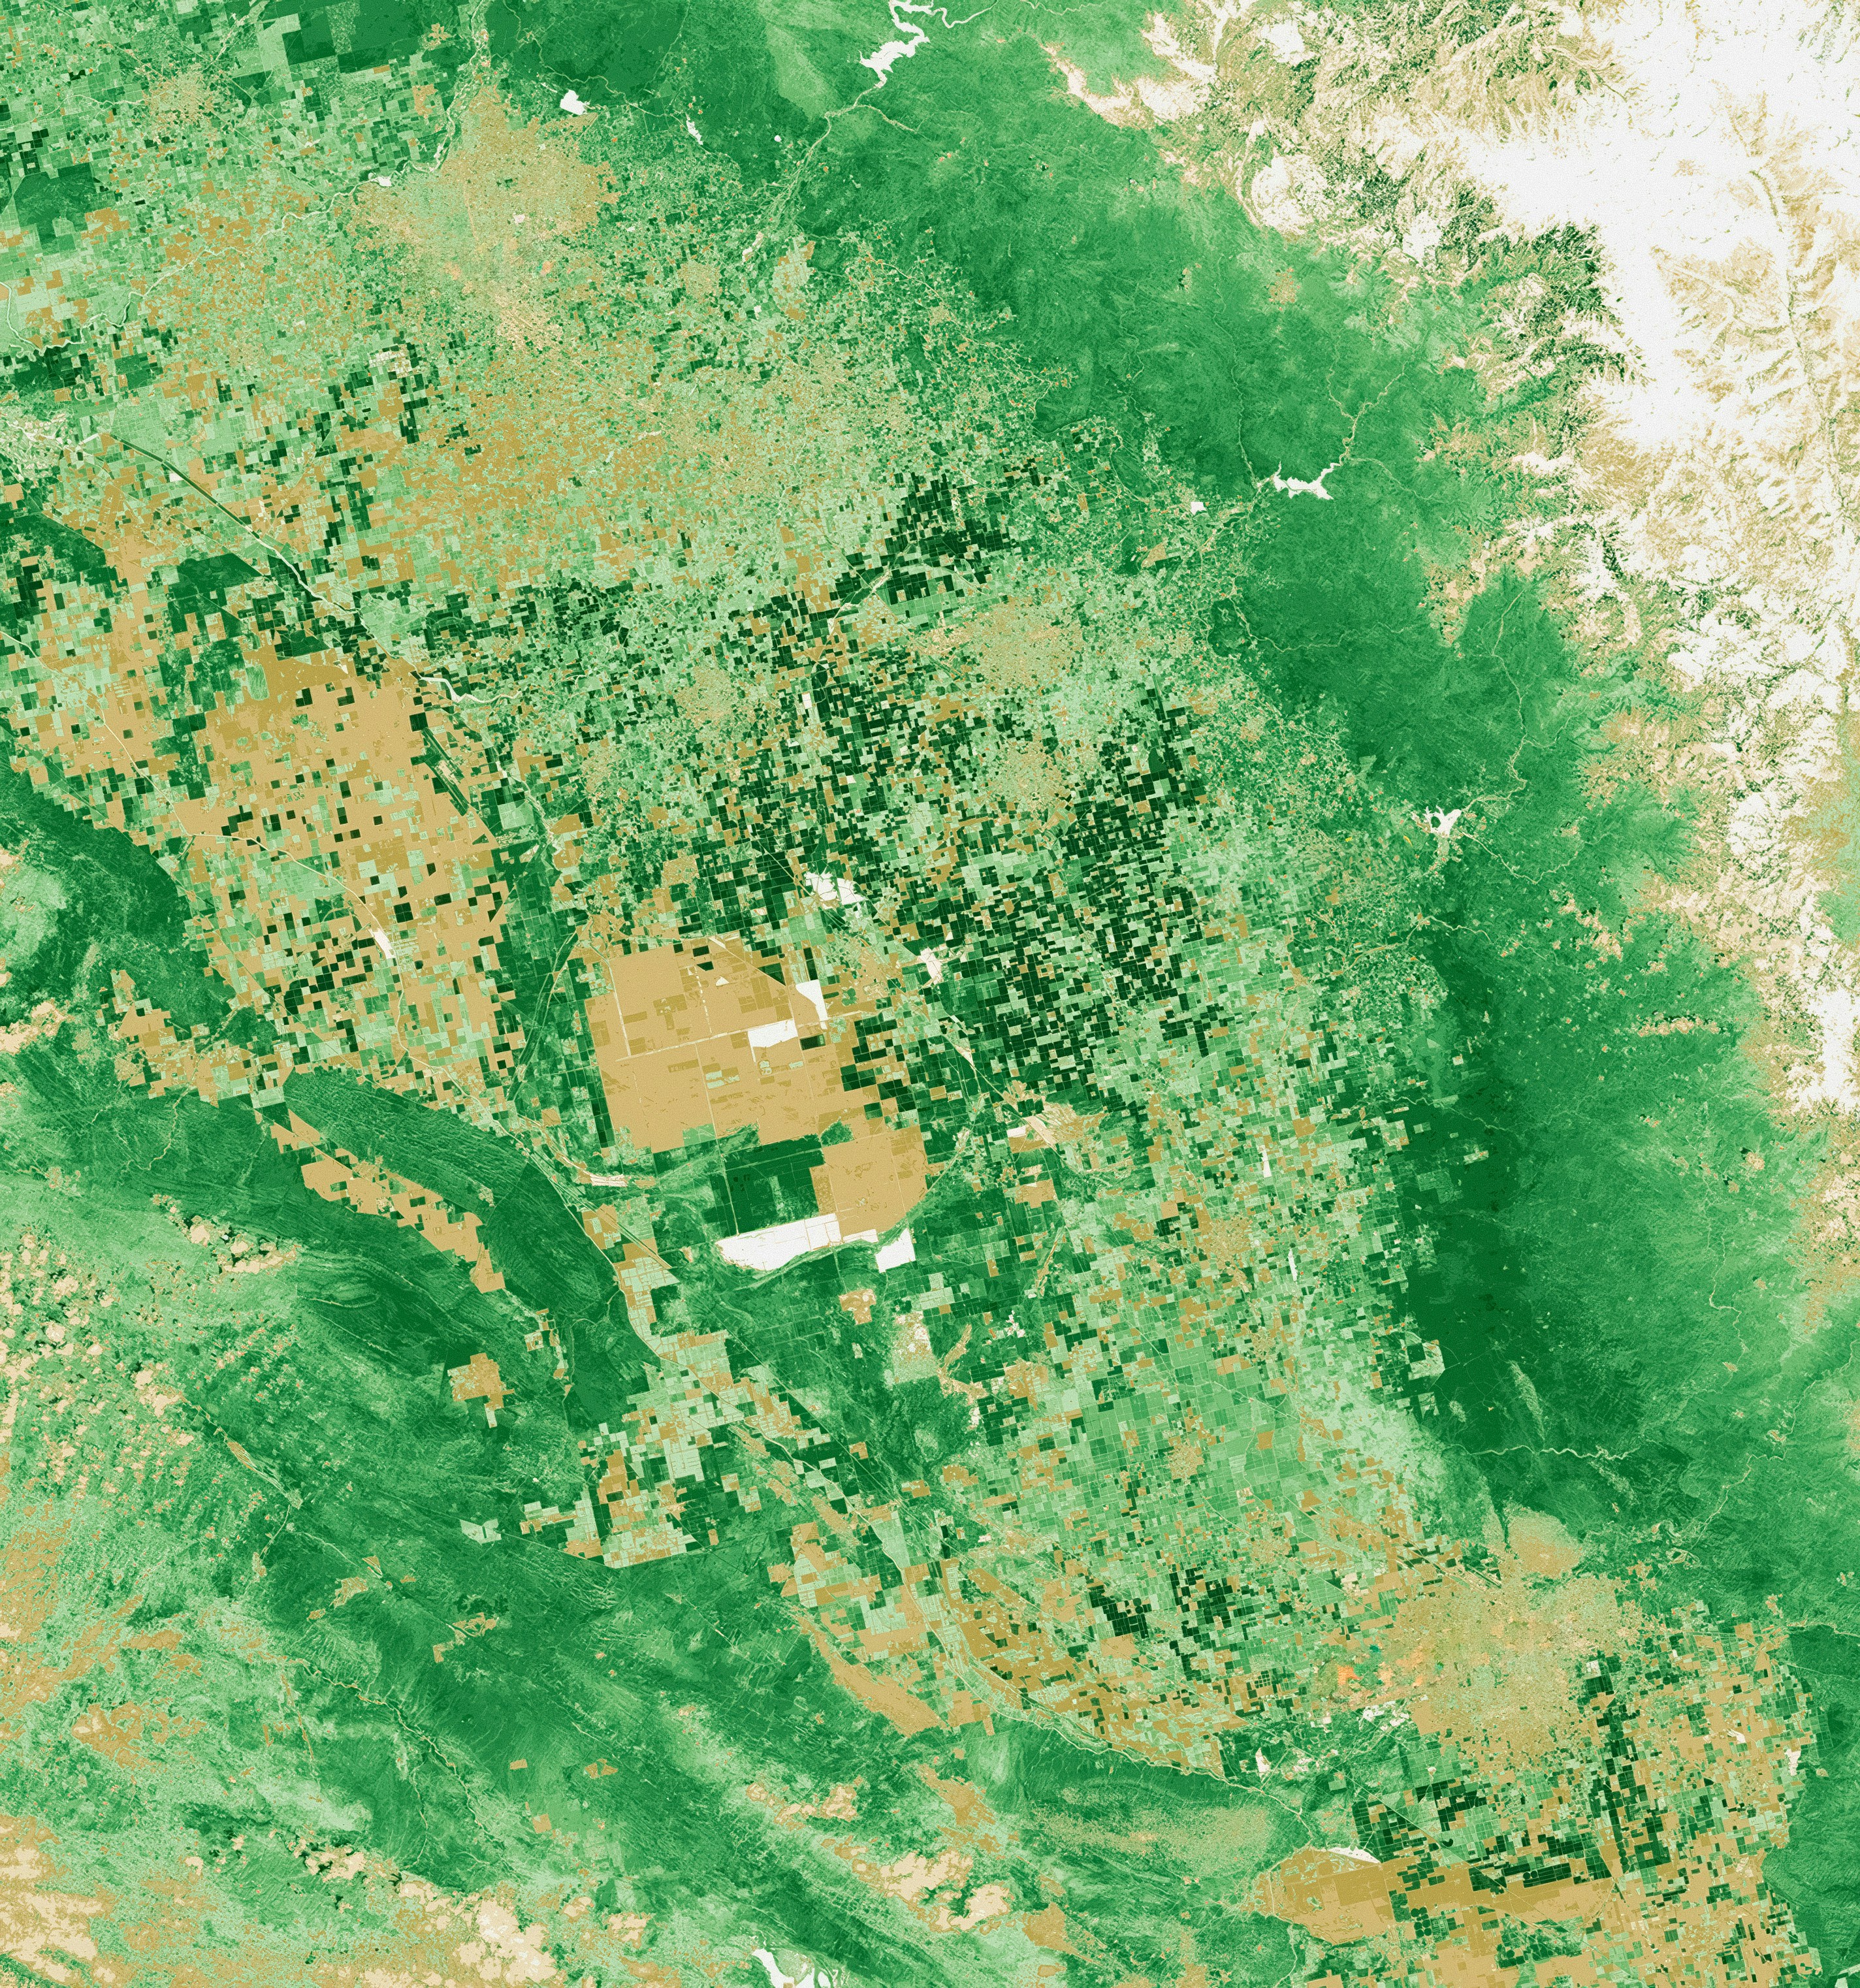
Multispectral Satellite Imagery
Sentinel-2 and Landsat-9 passes at 10m resolution, processed for NDVI, EVI, and bare soil indices. 72-hour revisit cycle captures crop stress before visible symptoms appear.

Soil Composition Profiles
Laboratory-grade analysis merged with digital soil maps. 847 variables across three soil horizons — organic content, clay fraction, cation exchange capacity, and nutrient availability.
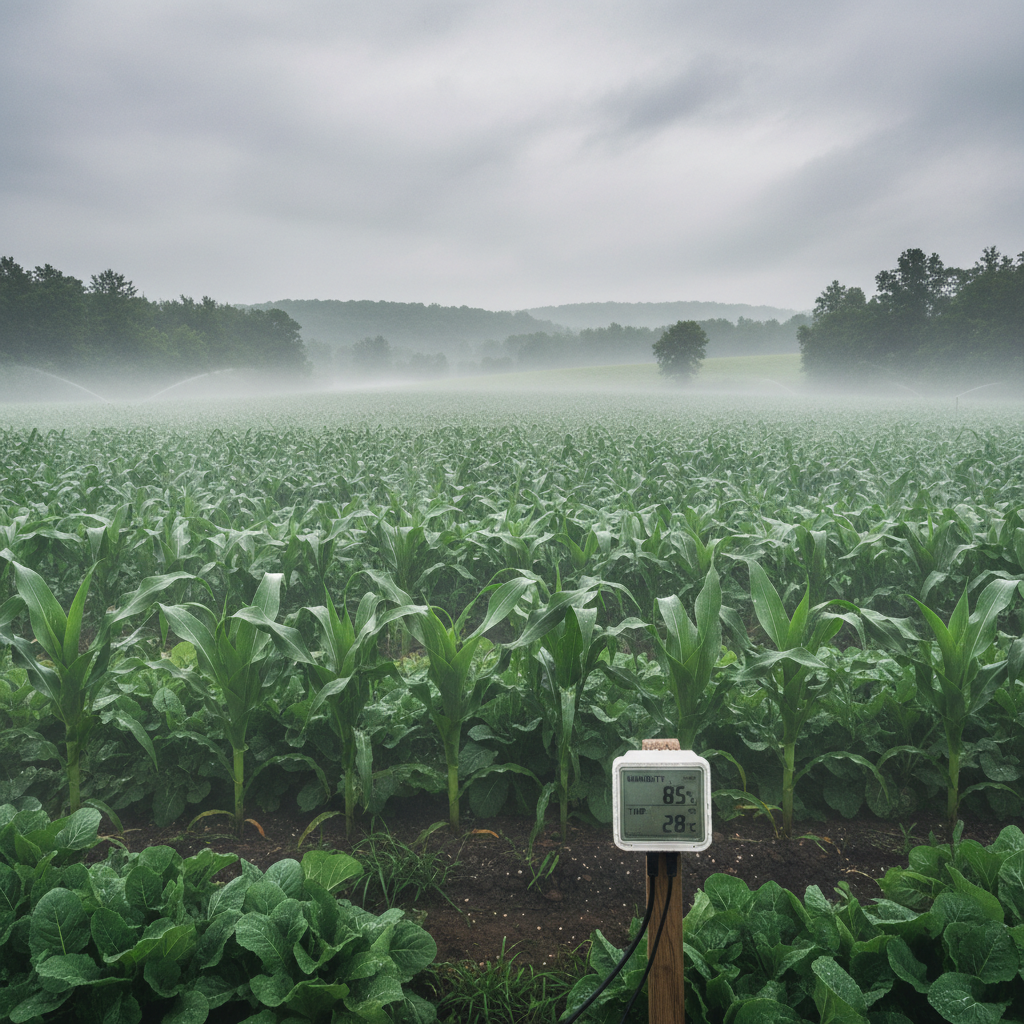
Microclimate Data Streams
Station networks interpolated to field-level resolution. Temperature, humidity, wind, and precipitation across a 14-day rolling window — the critical window for yield determination.
Every processing stage
occupies physical space.
The architecture is an exploded axonometric — four stages stacked like building floors, each refining the signal from the one below.
Spatial Feature Encoding
Convolutional layers extract spatial patterns from satellite imagery at multiple scales — field boundaries, crop density gradients, stress signatures.
Soil-Climate Fusion
Gradient-boosted trees merge tabular soil variables with time-series microclimate features. Handles missing sensor data through learned imputation.
Cross-Modal Integration
Transformer-based fusion aligns spatial and tabular representations. Attention weights reveal which inputs drive each parcel's prediction.
Yield Inference & Calibration
Conformal prediction wraps the point estimate in calibrated confidence intervals. Outputs are post-calibrated against 5 years of held-out validation.
Field boundaries.
Decimal precision.
The dashboard renders per-parcel predictions overlaid on your own field boundaries — with confidence intervals, historical accuracy, and exportable buy/sell signals.
Field A-7
AG36X6Tested against
2.3 million hectares.
We run 11,400 hectares of soybean rotation across four counties. Forecast gave us per-acre predictions in February that came within 2.8 bushels of our actual August harvest. That accuracy window changed how we allocate inputs entirely.
I advise seventeen cooperatives on seed and fertilizer allocation. Before Forecast, I was working off county extension averages and gut feel. Now I have field-level confidence intervals I can put in front of a board.

I trade regional soybean output variance for a mid-size commodity desk. The confidence intervals Forecast produces are tight enough to build hedge ratios against. We ran a backtest against five seasons — the model beat our internal analysts on RMSE three years out of five.

Drop a pin. Get your
first prediction free.
Select any field on the satellite map. We'll run the full prediction pipeline and return per-acre yield estimates with confidence intervals — in under 90 seconds. No credit card, no implementation timeline.
Tested on 2.3M hectares · ±3.2 bu/acre MAE on soybeans · No implementation required